Quickbase Application Development That Moves at Your Speed
New builds. Rescued apps. Rapid results. We use RAD methodology to deliver working software in days—not months—with your team in the loop every step of the way.
New builds. Rescued apps. Rapid results. We use RAD methodology to deliver working software in days—not months—with your team in the loop every step of the way.
The low-code platform that powers operational agility for complex businesses.
Quickbase is a low-code application development platform that enables organizations to build custom business applications without traditional programming. It combines the flexibility of custom software with the speed and accessibility of off-the-shelf solutions.
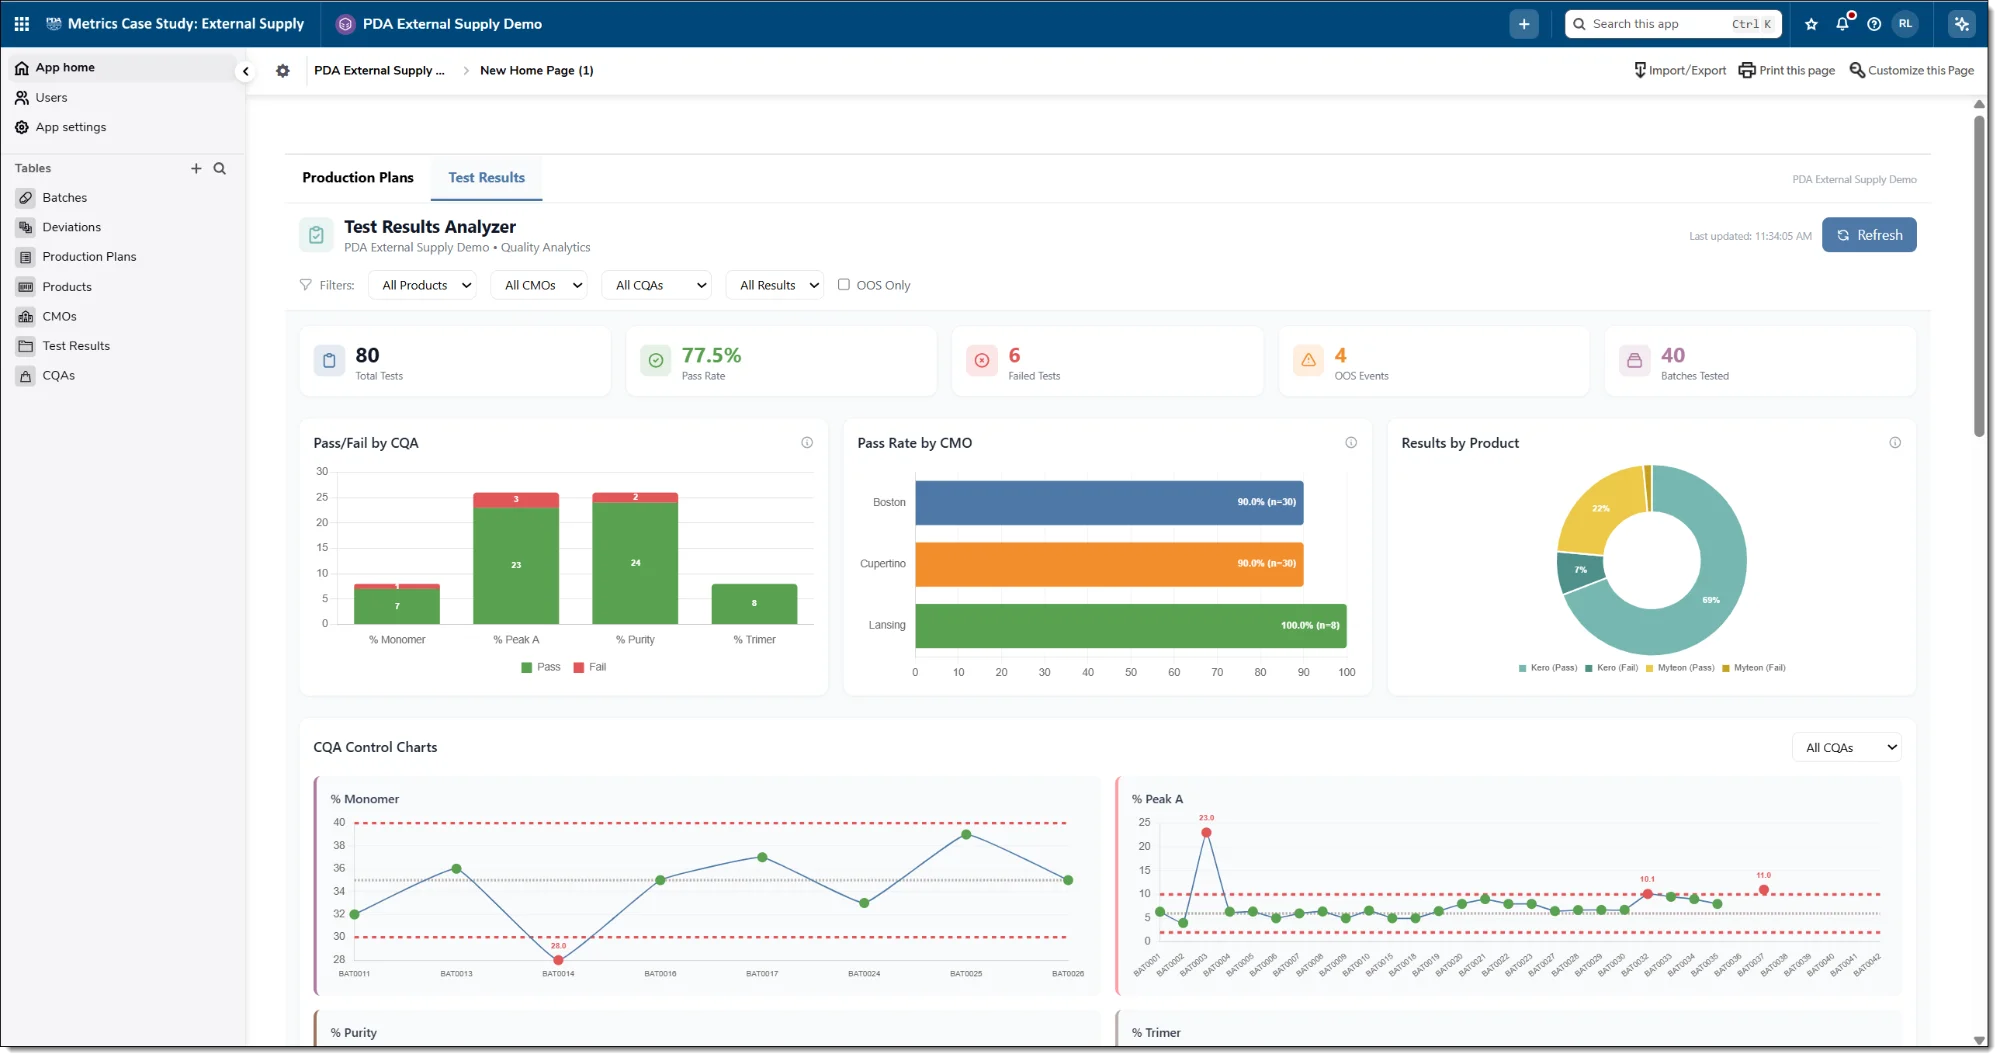
For manufacturing companies, Quickbase excels at operational workflows that don't fit neatly into ERP systems—quality management, production tracking, supplier management, document control, and regulatory compliance. It integrates with your existing systems while giving you the flexibility to adapt as your processes evolve.
Enterprise Low-Code Platform
Trusted by 12,000+ companies including 50% of the Fortune 100.
As an established Quickbase Partner, we bring both platform expertise and deep manufacturing domain knowledge to every engagement. Whether you're starting fresh or inheriting a tangled application that's grown beyond its original design, we get you to solid ground fast. Our RAD approach means you see working software early and often—not a requirements document that gathers dust.
Need to unlock insights from your Quickbase data? Our Analytics Package adds sophisticated Quickbase dashboards, Power BI based semantic models & reports, and AI-powered analysis to any application.

Rapid Application Development
Iterative sprints. Working software. Continuous feedback.
Traditional consulting delivers documentation. We deliver working applications—faster.
Short cycles with tangible deliverables. You see progress every week, not every quarter. Course corrections happen early when they're cheap.
Three standups per week keep everyone aligned. You're never surprised by what we're building—because you're helping shape it in real time.
We prioritize functional applications over comprehensive documentation. You get something you can use, test, and refine from day one.
Two paths to better Quickbase applications—both delivered with the same RAD methodology.
From concept to production
Fix, optimize, modernize
For mission-critical and regulated applications
A proven engagement rhythm that keeps projects moving and your team informed.
Choose the engagement model that fits your project timeline.
Maximum flexibility for evolving needs
Committed partnership, better rate
From first conversation to production deployment—here's how we work.
Understand your goals, assess existing systems, define initial scope and priorities.
Build a working proof-of-concept within the first sprint. Validate assumptions early.
Refine and expand through successive sprints. Adjust priorities based on feedback.
Launch to production with training, documentation, and ongoing support options.
What sets us apart from other Quickbase consultants.
Deep domain knowledge in MES, QMS, PLM, and ERP systems for medical device and battery production.
FDA 21 CFR Part 11, HIPAA, ISO 13485, and GMP compliance. Risk-based validation using CSA methodology.
IQ/OQ/PQ documentation, test scripts, and audit-ready deliverables for regulated deployments.
Test cases, traceability matrices, and defect logs throughout development—not just at the end.
Connect Quickbase to Power BI, external APIs, MCP servers, and enterprise systems.
Established Quickbase Partner with years of production implementations across regulated industries.
Working software in days, not months. Continuous delivery over big-bang launches.
We'd been struggling with a Quickbase app that had grown out of control. HarborView came in, understood our pain points in the first week, and had us on solid ground within a month. Their standup rhythm kept us connected without eating up our calendar.
Medical Device Manufacturer
We start with a discovery phase—usually a few calls to understand your goals, existing systems, and priorities. Then we move into sprint-based development with three 15-minute standups per week and one 1-hour project meeting.
Each sprint (typically 1-2 weeks) ends with working software you can test and provide feedback on. We adjust priorities continuously based on what we learn together.
Absolutely—remediation is half of what we do. We'll start with a health assessment to understand the current architecture, identify pain points, and prioritize fixes. Common issues include performance problems, broken automations, security gaps, and technical debt from years of ad-hoc changes.
We'll give you an honest assessment of what can be fixed in place versus what might benefit from a rebuild. Sometimes a targeted remediation is all you need; sometimes starting fresh is actually faster.
We begin with an application audit—reviewing table structures, relationships, automations, security settings, and performance bottlenecks. You'll get a written assessment with prioritized recommendations.
From there, we work through fixes in priority order. Some clients want us to handle everything; others prefer a hybrid where we tackle the complex issues and train their team on the rest. The same standup rhythm applies—you'll see progress weekly.
Scope changes are expected in RAD—they're a feature, not a bug. Our sprint-based approach means priorities can shift at the end of any sprint without derailing the project.
If you discover halfway through that a different feature is more valuable, we pivot. The monthly engagement model means you're paying for dedicated time, not a fixed deliverable. We'll always be transparent about trade-offs: adding scope here means deferring something there.
It varies widely based on complexity. A focused remediation might take 1-2 months. A new MES or QMS application typically runs 3-6 months. Large enterprise implementations with multiple integrated apps can extend beyond that.
The 6-month contract option works well for substantial projects. Month-to-month is ideal for smaller efforts or when you're not sure how long you'll need support.
Yes—while manufacturing is our specialty, the RAD methodology and Quickbase expertise apply broadly. We've built applications for project management, customer portals, field service, and operational workflows across industries.
That said, our deepest expertise is in regulated manufacturing environments where we understand the compliance requirements and domain-specific challenges.
As the contract nears completion, we'll discuss next steps together. Options include renewing at the same rate, transitioning to month-to-month for ongoing support, or wrapping up with a clean handoff including documentation and training.
You're never locked into continued engagement—but most clients find ongoing support valuable for maintenance, enhancements, and new initiatives as they arise.
For standard projects, we provide test scripts for each sprint deliverable with documented test cases and expected results. You'll have a clear record of what was tested and how.
For mission-critical or regulated applications, we go further: full traceability matrices linking requirements to test cases, defect tracking logs, and formal test summary reports. Everything is audit-ready from day one.
Yes—this is a core competency for us. We develop complete IQ/OQ/PQ (Installation, Operational, and Performance Qualification) protocols tailored to your application and regulatory requirements.
We use a risk-based approach aligned with the FDA's Computer Software Assurance (CSA) guidance, focusing testing effort where it matters most based on patient safety and data integrity risk. This replaces the outdated "test everything equally" approach with smarter, more efficient validation.
The deliverables include validation plans, protocol documents with step-by-step test procedures, expected results, and sign-off sections. We also provide FDA 21 CFR Part 11 compliance mapping, HIPAA security controls documentation where applicable, and validation summary reports. These documents are designed to satisfy auditors and quality teams.
They're designed to work together. Well-structured Quickbase applications are the foundation for effective analytics. As we build or remediate your apps, we're thinking about reporting requirements and data architecture from the start.
When you're ready to add dashboards, Power BI integration, or AI-powered analytics, the transition is seamless because the underlying data model was designed with analytics in mind.
For month-to-month engagements, you can pause or end with 30 days notice. We'll ensure a clean handoff with documentation of work completed and any in-progress items.
For 6-month contracts, we can discuss pause provisions if circumstances change significantly. We're reasonable people—if something unexpected happens on your end, we'll work together to find a fair solution.
Whether you're building something new or rescuing an existing application, tell us about your needs and we'll help you find the right path forward.